Battery and Ultracapacitor Modelling and Experimental Identification
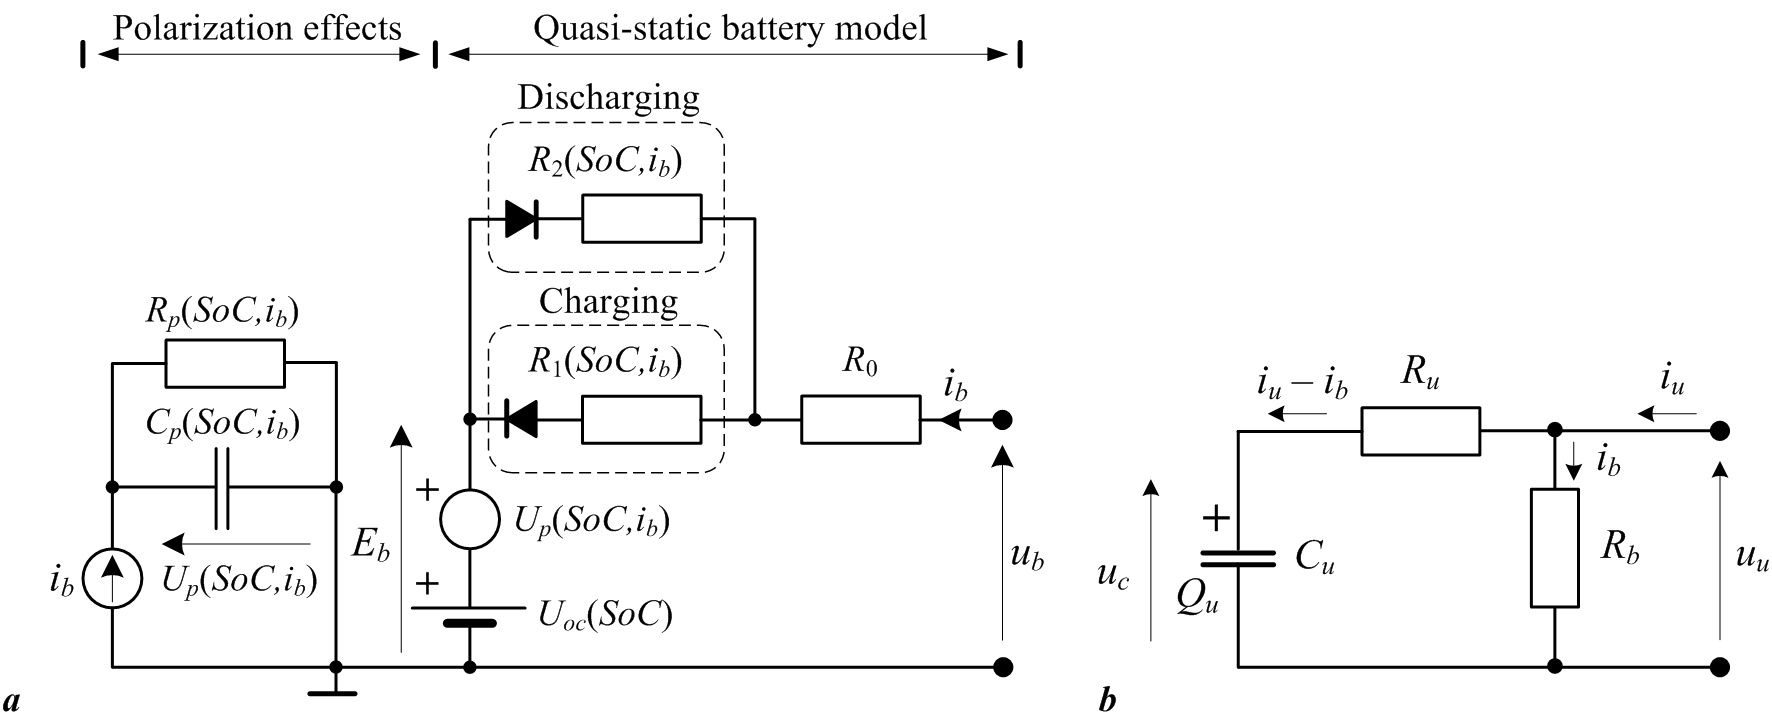
In practical applications, electrochemical batteries and ultracapacitors are typically modeled by equivalent electrical circuits, which describe the dominant battery/ultracapacitor voltage/current phenomena. Fig. 1a shows the battery equivalent circuit model, which comprises the so-called quasi-static battery model, and the model of electrolyte polarization effects. The quasi-static model includes two series-connected voltage sources denoting the battery open-circuit voltage Uoc and the electrolyte polarization effects symbolized through the “polarization” voltage Up. The resistive power losses are described by equivalent resistances, where R0 may denote the battery terminal resistance, while R1 and R2 correspond to battery internal resistive losses for charging and discharging, respectively (where “ideal” diodes denote charging or discharging operation). The aforementioned battery model parameters are typically SoC-dependent (SoC is the battery state-of-charge), and may also depend on the battery charging/discharging current. The polarization voltage dynamics are modeled by a parallel resistive-capacitive (RC) circuit fed by the battery current ib. On the other hand, ultracapacitor modules comprising a number of cells in a series-parallel configuration, can be modeled by a lumped-parameter series RC circuit comprising the equivalent capacitance Cu and series resistance Ru, as shown in Fig. 1b. Since cell voltage is subject to rather stringent limitations (cell voltage should be kept below 3 V), the individual cells within the ultracapacitor module need to be equipped with a charge balancing system. The effect of cell-balancing intervention can be represented by the equivalent resistance Rb connected in parallel to the “ideal” series RC circuit utilized for modeling of the ultracapacitor module voltage and current dynamics (see Fig. 1b).
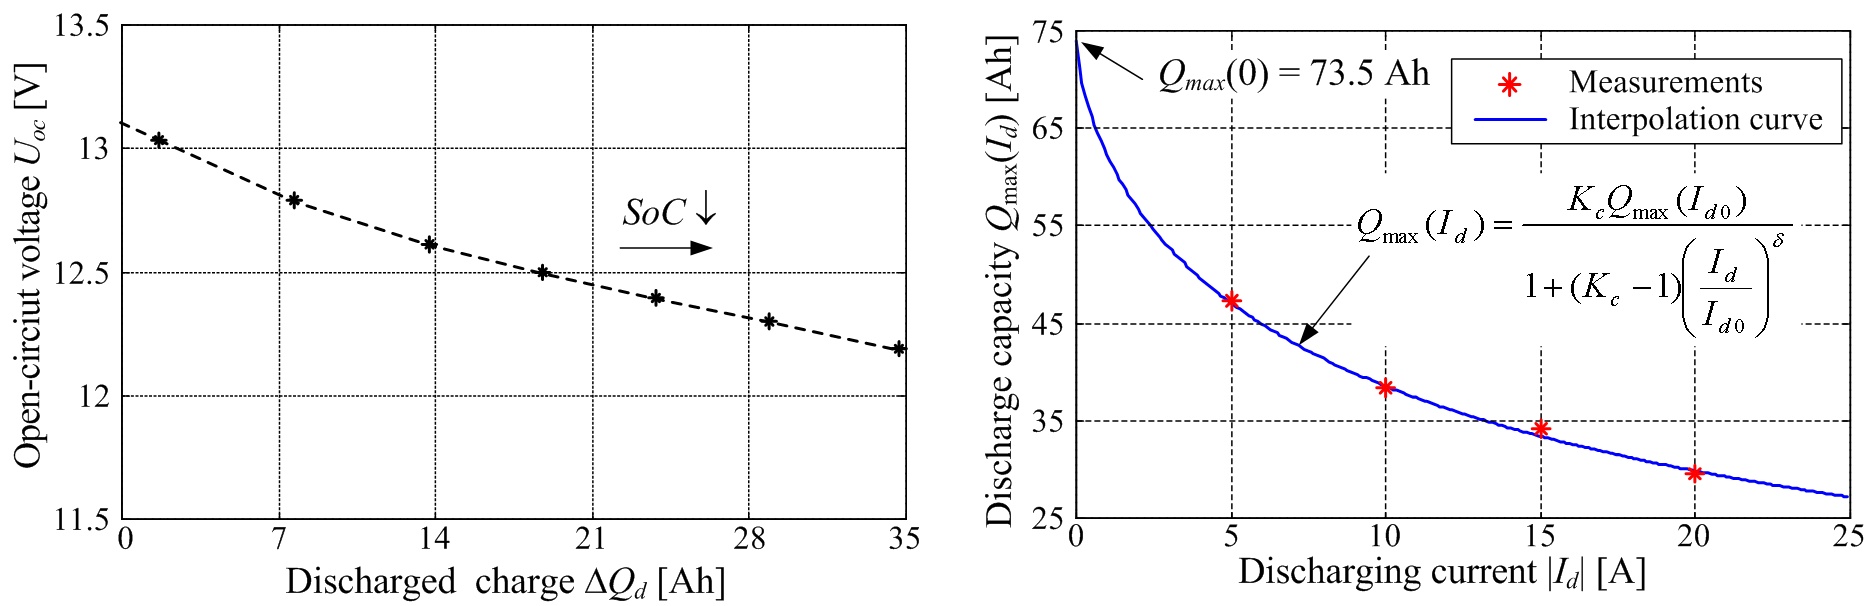
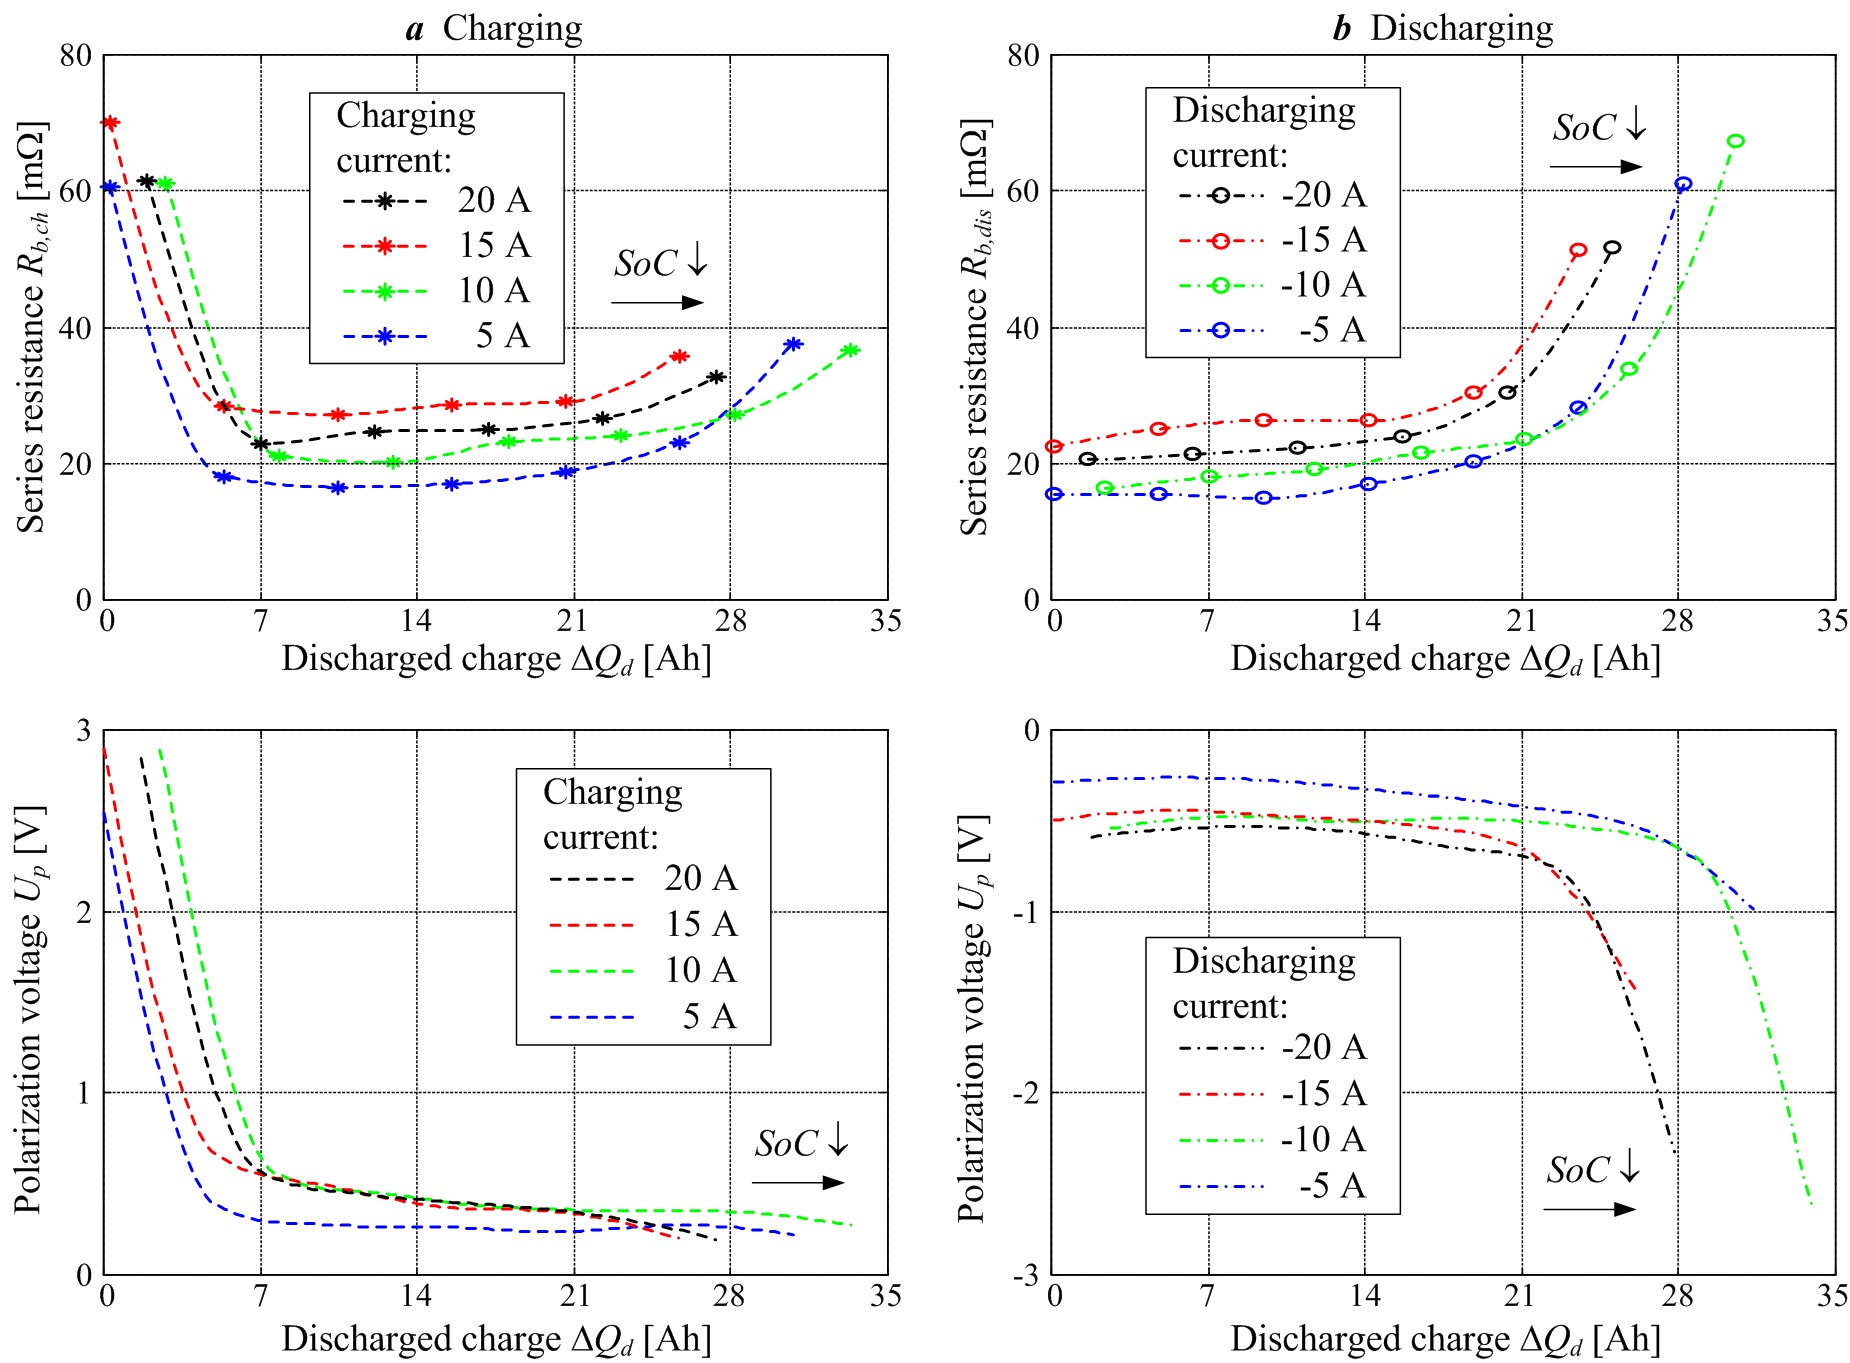
The results of step-by-step experimental identification of an automotive valve-regulated lead-acid (VRLA) battery are shown in Figs. 2 and 3. Figure 2 shows the resulting battery open-circuit voltage and battery charge capacity curves, which are recorded by using constant-current discharging tests. In the case of open-circuit voltage curve (Fig. 2a), the battery is periodically briefly discharged (under current control) by a relatively large current, followed by battery recuperation and voltage settling periods for at least 1 hour. On the other hand, the recording of battery charge capacity vs. discharging current dependence (Fig. 2b) is carried out by continuous battery discharging until it can no longer support the commanded discharging current Id. The battery capacity vs. discharging current points Qmax(Id) in Fig. 2b are then interpolated in the least squares sense, and the interpolation curve agrees very well with the data points (measurements) obtained by discharging tests. The battery internal resistance and steady-state polarization voltage identification experiments are carried out in the current control loop, wherein a relatively “fast” triangular (saw-tooth) signal is superimposed to a constant current reference in order to provoke low-magnitude battery current and terminal voltage perturbations. The resulting battery terminal voltage and current responses are then processed by means of a Kalman filter-based parameter estimator. The final results of steady-state battery parameter estimation over a wide range of battery operation are shown in Fig. 3.
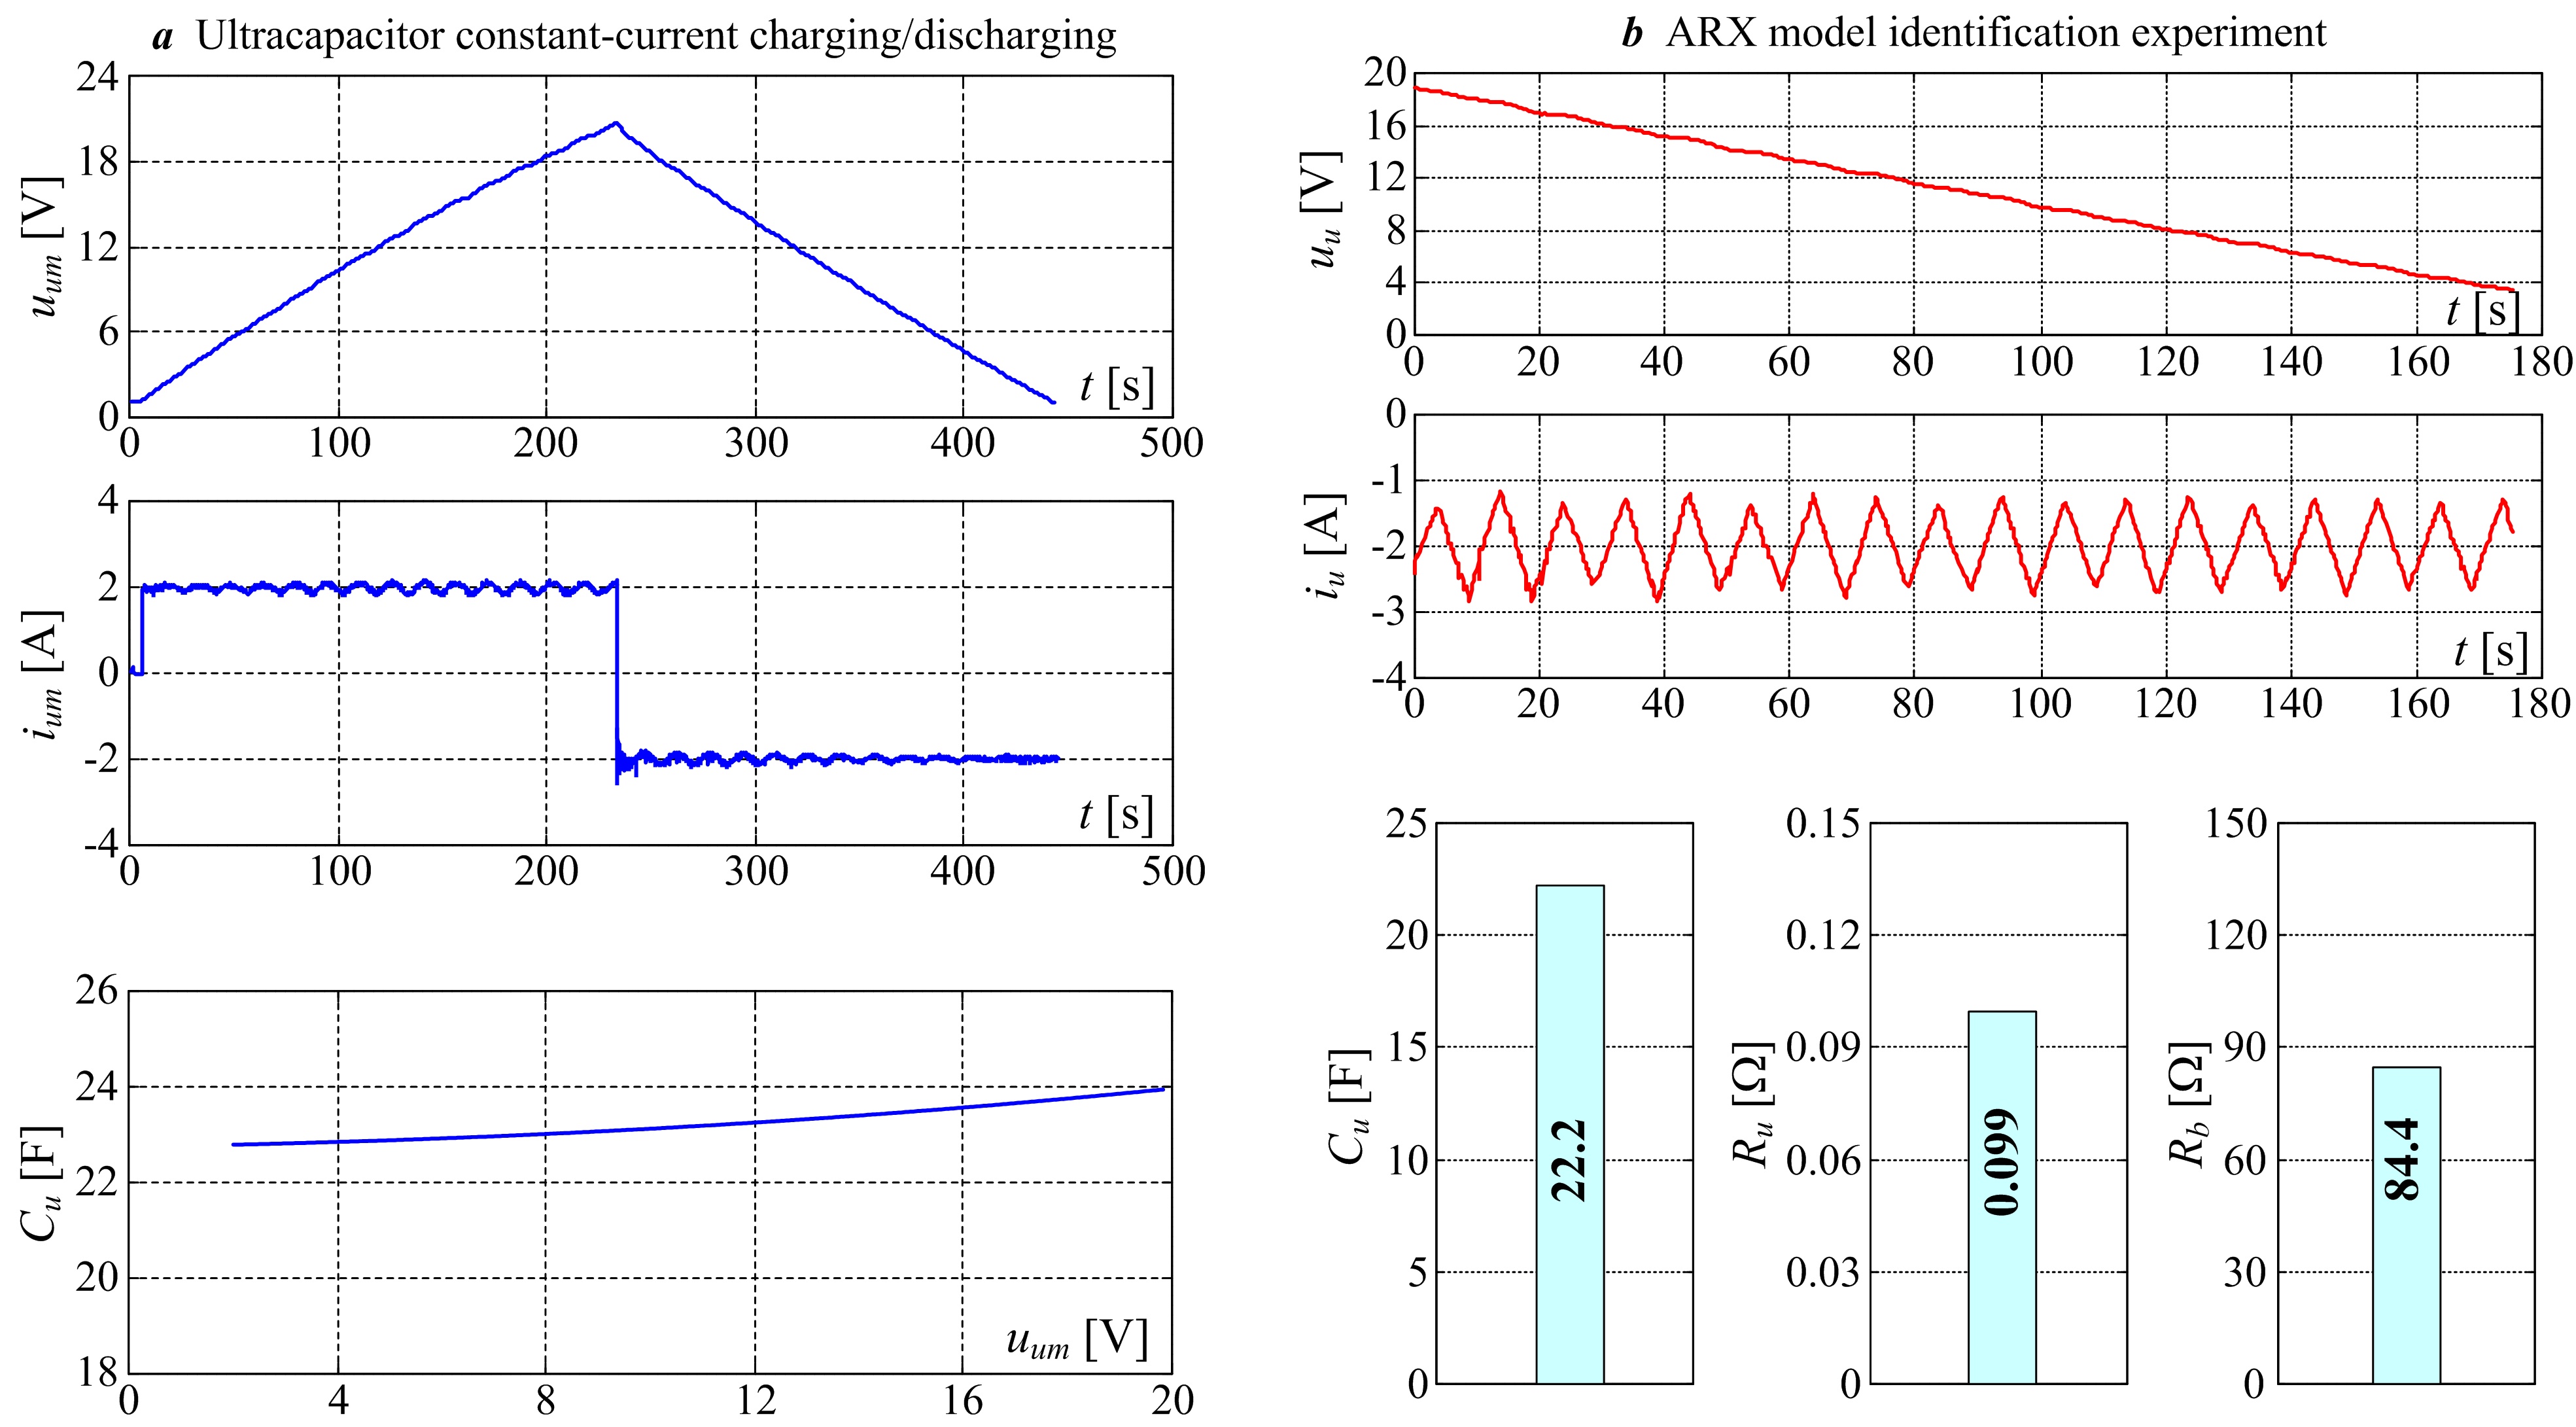
The ultracapacitor module equivalent capacitance Cu can be estimated by means of charging/discharging experiment shown in Fig. 4a. The resulting capacitance vs. voltage curve for the 22.2F/24V ultracapacitor module is shown in Fig. 4a, wherein a certain increase with the ultracapacitor terminal voltage can be observed. This phenomenon is primarily attributed to the internal charge distribution processes within ultracapacitor cells. Alternatively, the parameters of the constant-parameter ultracapacitor module model can be estimated based on the identification of equivalent discrete-time ARX process model by using the least-squares (LS) identification approach. Identification of ARX process model is performed within closed current control loop (for safety reasons), wherein a triangular (saw-tooth) current profile has been applied (Fig. 4b). The final results of equivalent RC circuit parameter estimation are also shown in Fig. 4b.
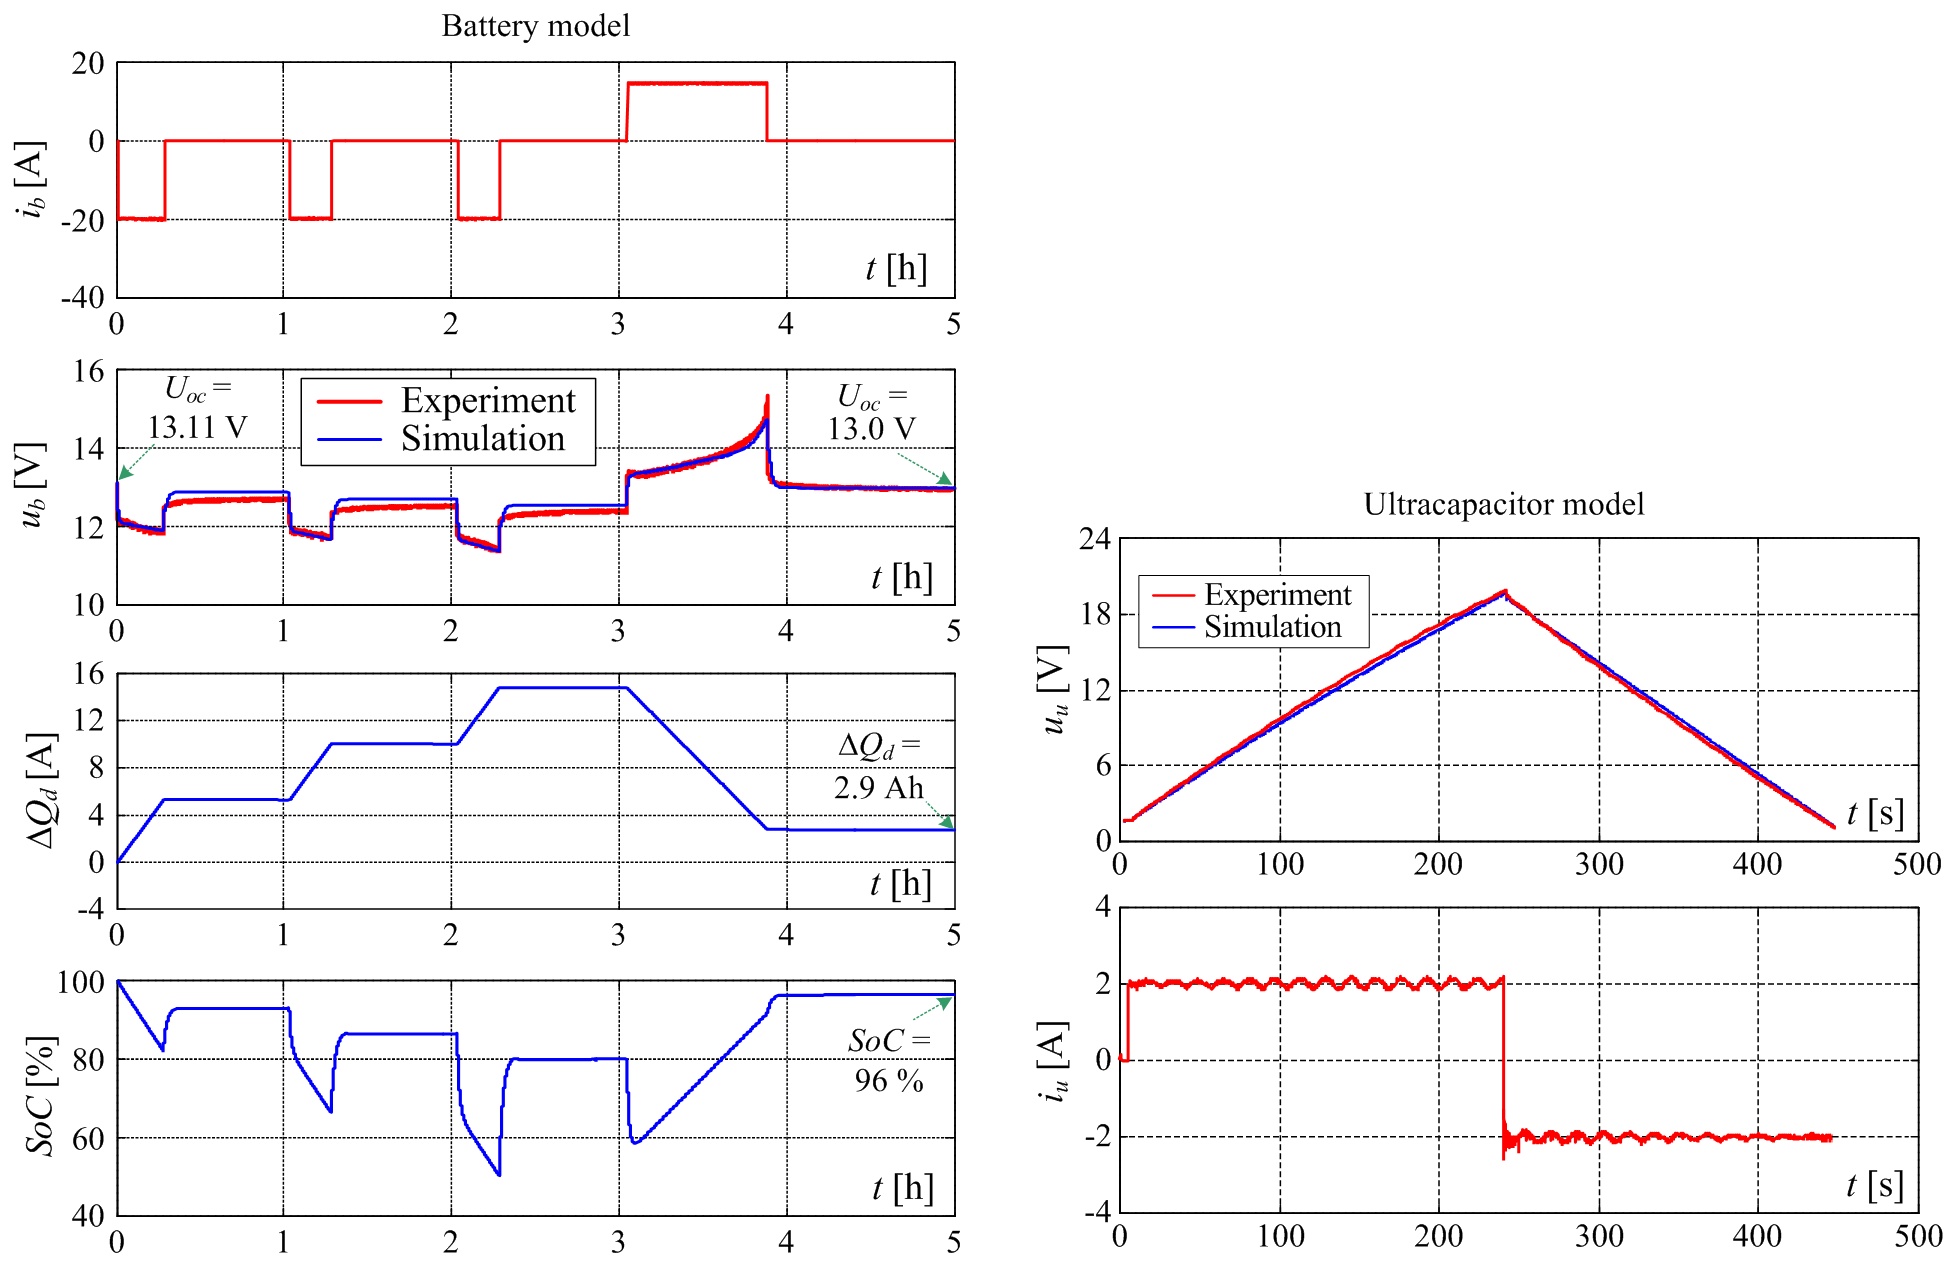
The estimated parameters of the battery and ultracapacitor equivalent electrical circuits are used to build the corresponding simulation models which are then validated against experimental data recorded on the battery/ultracapacitor test setup. Figure 5a shows the comparative experimental responses and battery simulation model results for the case of pulsed-current profile. The battery model is able to track the experimentally-recorded battery terminal voltage profile rather well, even though the battery voltage during idling (ib = 0) is characterized by a rather slow settling (“creeping”) towards the open-circuit voltage value. Moreover, the obtained final Uoc value (at the end of experiment) closely matches the anticipated Uoc value from simulation. The results of ultracapacitor model validation are shown in Fig. 5b, wherein the ultracapacitior simulation model has been implemented with the previously-recorded capacitance static curve (see Fig. 4a) and constant-valued series and parallel resistances Ru and Rb (shown in Fig. 4b). The comparative simulation and experimental results for the case of constant charging and discharging show that rather good tracking of the experimentally-obtained ultracapacitor terminal voltage can be obtained over a wide range of ultracapacitor operation.
Publications
-
Proceedings of IEEE EUROCON 2015, Salamanca, Spain, 2015. -
Design of EKF-based SoC Estimator for an Ultracapacitor Module
Proceedings of IEEE EUROCON 2015, Salamanca, Spain, 2015. -
Battery Current and Voltage Control System Design with Charging Application
Proc. of the 2014 IEEE Multiconference on Systems and Control (IEEE MSC 2014), pp. 1133-1138, Antibes, Francuska, 2014. -
Dual Kalman Filter-Based SoC/SoH Estimator for an Ultracapacitor Module
Proc. of the 2014 IEEE Multiconference on Systems and Control (IEEE MSC 2014), pp. 1783-1788, Antibes, Francuska, 2014. -
Development of Smart Charging and Energy Management Controls for Batteries and Ultracapacitors
In Proc. of NIDays 2014 Conference, Zagreb, Croatia, 2014. -
A Design of DC Bus Control System for EVs Based on Battery/Ultracapacitor Hybrid Energy Storage
IEEE International Electrical Vehicle Conference (IEVC 2014), Florence, Italy, 2014. -
Energy Storage Systems Sizing Study for a High-Altitude Wind Energy Application
Energy, Vol. 76, pp. 91-103, 2014. -
Battery/Ultracapacitor Test Setup Control System Design and Verification
Proceedings of IEEE Eurocon 2013, pp. 1050-1057, Zagreb, Croatia, 2013. -
Energy Storage Systems Sizing Study for Airborne Wind Energy Applications
8th Conference on Sustainable Development of Energy, Water and Environment Systems (SDEWES), Dubrovnik, Croatia, 2013. -
Control-Oriented Modeling and Experimental Identification of an Ultracapacitor Module
2013 Electrical Drives & Power Electronics Conference (EDPE 2013), Dubrovnik, Croatia, 2013. -
Control-Oriented Modeling and Experimental Identification of a VRLA Battery
2013 Electrical Drives & Power Electronics Conference (EDPE 2013), Dubrovnik, Croatia, 2013. -
Battery/Ultracapacitor Test Setup Design
In Proc. of NIDays 2013 Conference, Zagreb, Croatia, 2013. -
Modeling of Hydro-Pneumatic Energy Storage System
CD-ROM Proceedings of the 8th EUROSIM Congress on Modelling and Simulation, Cardiff UK, 2013. -
An Overview of Energy Storage Systems Considering Renewable Energy Applications
Proc. of 6th Dubrovnik Conference on Sustainable Development of Energy, Water and Environment Systems (SDEWES), Dubrovnik, Croatia, 2011.